In this guide, we will see the next steps to perform after installing power BI Desktop on your computer and an example case: the Calculation Groups.
Install external apps in Power BI
After installing Power BI Desktop, we recommend installing three very useful external applications. To do this, in the Power BI Help menu, click the “External tools” button.

That will open a window in your default browser, Using external tools in Power BI Desktop.
On that page, you'll get a preview of three tools that, used together, will allow you to get more Power BI functionality and solve complex situations.
These tools are:
A lightweight editor for SQL Server Analysis Services tabular models built on .NET/WinForms
Tools for developing and modifying DAX queries
Open source tool used to manage Power BI datasets.
Occasionally the installation of the ALM tools may cause a negative response from the antivirus, in which case it creates an exception for the application.
Once installed, a new menu option will appear in Power BI in which the installed tools will appear:

Calculation groups. example case
In a data model where we have different measures in several tables, we may need to create several calculated measures based on these measures, such as:
- The cumulative value of the month to the current date (MTD: Month to Date)
- The accumulated value of the year to date (YTD: Year to Date)
- The accumulated value of the previous year (Previous Year).
That means creating as many calculated measures as there are measures to which we want to apply these calculations, which means a significant increase in work.
Creating a group of calculations will allow us to considerably reduce the work to be done.
Use the external tool Tab editor to create a calculation group
To create a group of calculations we can use the external tool Tab Editor.
To do this we will go to the Power Bi external tools menu, present since the July 2020 version.
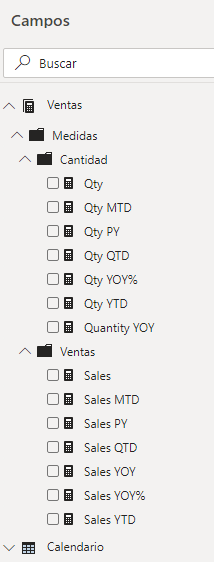
When opened, the editor will be directly connected to the data set (Dataset) of the report on which we are working at that moment, so we already see our calculated measures.

To create our group of calculations, the first thing will be to create the folder that will host them:

The newly created group will appear as:
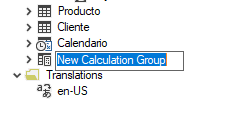
We can rename it as we see fit, for example temporary calculations.
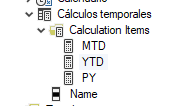
If we expand the node we can see that it is a table with a single field with multiple rows based on the calculation items (Calculation items)

The calculation elements are equivalent to the calculated measures that we had previously created.
We will start creating calculation items by right clicking and selecting New Calculation Item.

We can start with the accumulated value of the month to date or Month to Date, MTD for short.
We have two options, either we start writing our DAX code in the editor section:

Or we can go to the PBIX report and select and copy the code that we have created for one of our MTD measures:
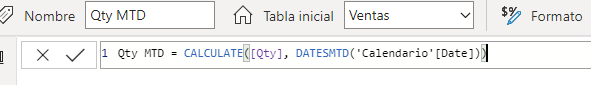
We will copy the code that is to the right of the equal sign (=) and proceed to paste that code in the editor:
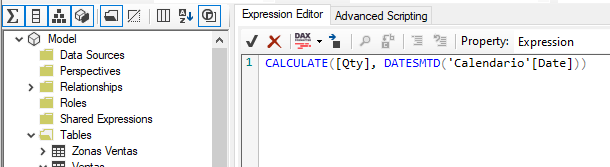
However, instead of keeping the [Qty] measure, we will replace it with the SELECTEDMEASURE() function that returns the measure that we are evaluating.
Once our calculation elements are created, we will save the changes in the program menu.
If we go back to the GDP report, we will see that there are changes and the report needs to be updated.

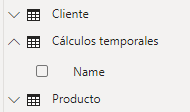
We can see that the Temporary calculations element has appeared in our model
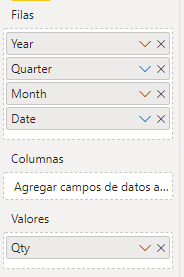
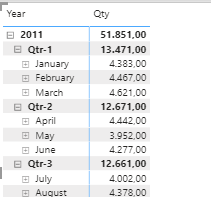
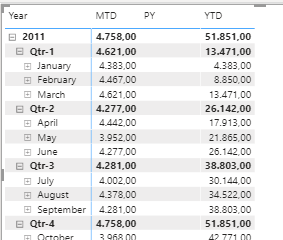
If we add a matrix to the report and select elements from the calendar table in the rows and place the quantity measure Qty in the values, we can see the result in the matrix
If we add the Name field of the calculation group to the columns, things change and the following appears:
Conclusion: goal achieved
In a single step we have managed to obtain a matrix in which to start breaking down all kinds of calculations on the Qty measure based on the calculation elements that we created in the group.
And all this without having to write all the temporary calculated measures for each measure.
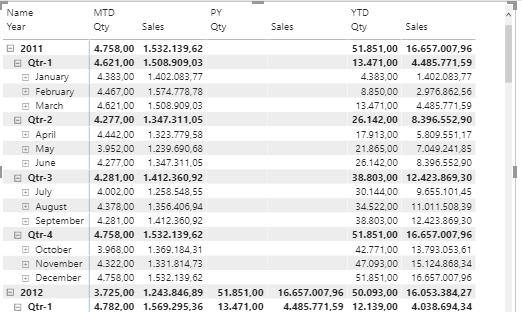
If we add the Sales measure to the values, the matrix starts to show us a complex data structure in one step:

Do you want to implement Power BI in your company?
We help you!
In Emiral We know how much your company is worth, whether it is small, medium or large. For this reason, we want to offer you the best ERP management solutions so that your business continues to grow.